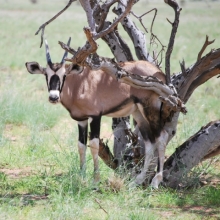
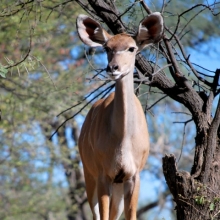
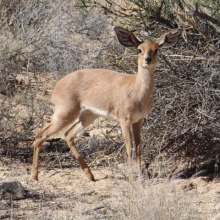
Two methods are used to assess game numbers in the landscape:
1. Game Counts
A structured game count is carried out annually in June to assess population sizes, distributions and status. Game counts were initiated in Gondwana Canyon Park in 2003.
Zones
For the purposes of the count, the count area is divided into game count zones, each with its own standardised route. The first game count, in 2003, started with 7 game count zones; over time there were some changes to the number and extent of zones and by 2012 there were 8 zones. In 2015 a further 4 properties were added, and the number of zones thus increased to 13. For this website each zone is designated a code such as GC01.
» See a map of the zones.
Habitats
In addition, the landscape has been zoned according to habitat. The following habitats have been defined: mountain escarpment, koppies and inselbergs, gravel plains, sandy plains, Naute dam, farm land, and Incised rocky hills.
» See a map of the habitats.
Methodology
The basic survey methodology used is a road count using a combination of the Distance and the Strip-Count census techniques. In layman’s terms, these can be explained as follows:
Distance
All animals are counted and the distance to each animal, or group of animals, is recorded at right angles to the vehicle. This distance allows us to apply a species' correction factor for each type of animal counted. This is done in order to compensate for animals not seen. For example, the chances of seeing large animals like zebra over a great distance are much higher than the probability or chances of seeing a smaller animal like a steenbok. Therefore a correction factor of 1.2 can be used for zebra (because one is likely to see most of them over a set distance). A much higher correction factor of 10 can be used for steenbok – over the same set distance one is likely to see only a few steenbok while the rest will be hidden by "dead" ground or obstacles.
Strip-count
All animals are counted and the distance to each is recorded, at right angles to the vehicle. A strip-width is then determined so that the area covered can then be multiplied into the overall area. This is known as an area correction factor (the number of times a 1000m wide strip will fit into the whole area). Only the animals inside the 1000m area (500m on either side of the road) are multiplied by the correction factor, in order to determine the population estimate for the given area.
2. Supplementary Game Estimates
For those areas which are not included in the annual game count, estimates of the number of animals of each species are made based on a range of methods such as incidental observations, camera traps and informal game counts. These estimates comprise an estimated number of animals in a given area, typically a farm. These estimates are currently only available for 2013. For this website these areas are designated a code such as GE01. Density and biomass values are then calculated from the numbers of animals and farm size. Formulas are given in
this spreadsheet.
Species and Biomass
The species for which data are included on this website, and the biomass values used, are as follows:
|
Species |
Biomass (kg) |
|
Gemsbok |
220 |
|
Hartebeest |
130 |
|
Jackal |
|
|
Klipspringer |
12 |
|
Kudu |
180 |
|
Ostrich |
68 |
|
Springbok |
38 |
|
Steenbok |
11 |
|
Zebra, Burchell's |
300 |
|
Zebra, Mountain |
280 |
Results
Use the lists to view maps, charts and tables of game count results for selected species and years. For a full discussion of the methodology and results see the game count reports under
Literature.


